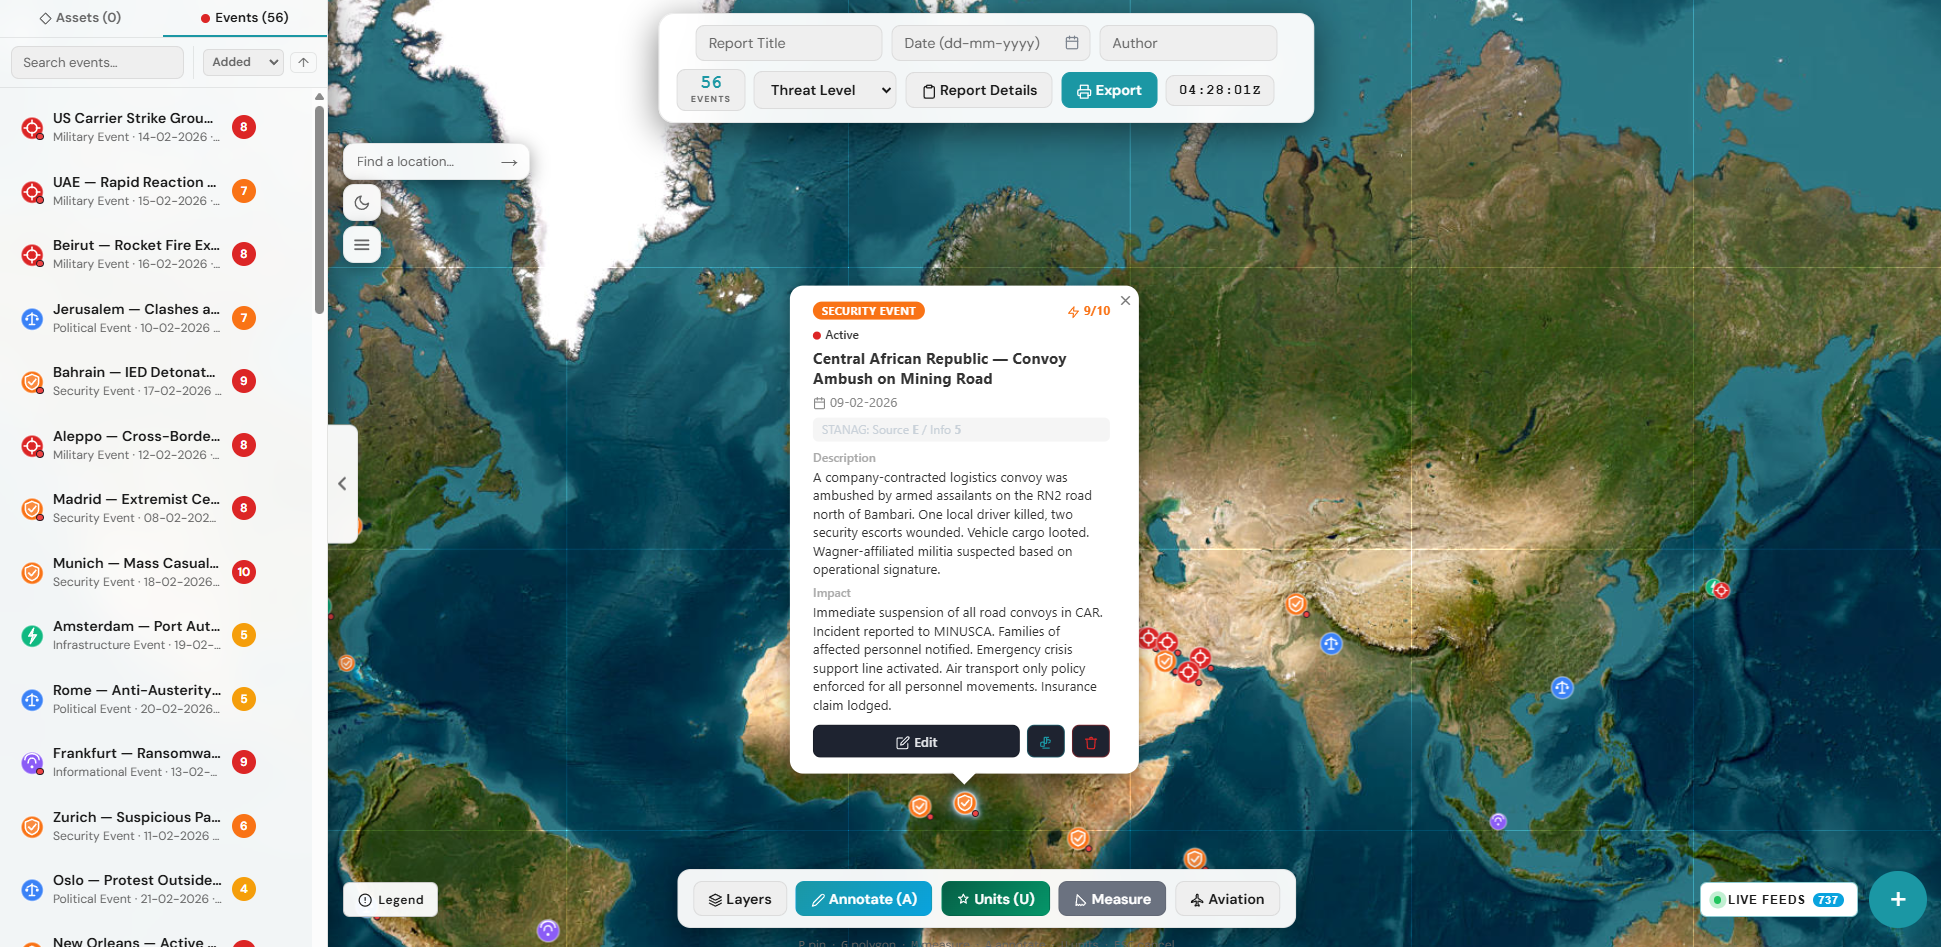
The Situation Report module gives security teams a live operational map to plot observations, log assets, and generate structured HTML briefings — without leaving the browser.
Everything your team needs to build and share a live common operating picture.
Drag-and-drop observations and draw polygon zones on a real-time map. Attach title, type, severity, UTC timestamp, description, and photos to every pin.
Track 60+ asset types across 7 categories — personnel, vehicles, equipment, aircraft, maritime, infrastructure, and more — on the same operational map.
Civil and military aircraft positions via OpenSky and ADSB.lol, auto-refreshed every 30 seconds, displayed directly on your operational map.
Log observations using structured fields aligned to STANAG reporting conventions, ensuring consistency across teams and deployments.
Scrub through observations chronologically using the built-in UTC timeline to reconstruct observation sequences and understand how situations evolved.
Generate a fully self-contained HTML briefing your stakeholders can pan, zoom, and explore — no app required on their end.
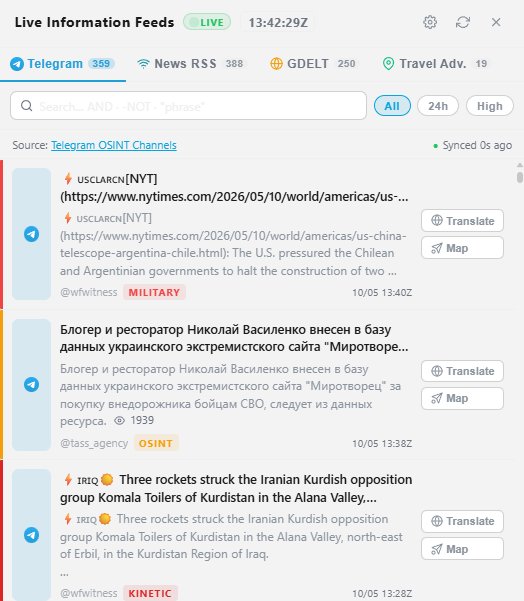
Stream live intelligence from Telegram channels, global news via GDELT and RSS, and official travel advisories — all inside the Situation Report. Translate foreign-language content in place, search across all feeds, and plot observations directly onto the operational map with a single click. Anything that lands in the feed can be immediately escalated into a structured Intelligence Analysis or attached to a Risk Assessment — no copy-paste, no context lost.
Situation Report is used by teams who need a fast, shared operational picture during live events.
Need a real-time common operating picture to brief senior leadership during incidents.
Tracking personnel, vehicles, and equipment across a dynamic area of operations.
Producing clear, shareable location-based briefings for internal and external stakeholders.
Create your first Situation Report in minutes — no installation required.